Relevant only to DIN 2093 specification

The fatigue life diagrams attempt to provide the disc spring user with a means of assessing disc spring fatigue life using the data published on this website. This data is based on actual tests and extrapolated test results of this type of carbon steel disc spring.

For disc springs of a specialised nature, and those manufactured in any of the wide range of alternative corrosion and heat resisting alloys, we recommend that you seek expert assistance from ourselves.

Complete the blow form for competitive quote

Please contact us for more information by using our
disc spring enquiry form.

Click on diagrams to view larger versions.

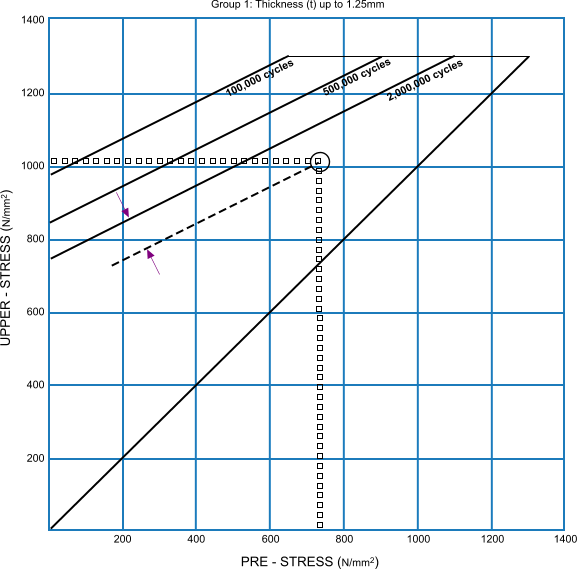
Group 1

Thickness (t) up to 1.25mm

graph showing DIN 2093 - Group 1: Thickness (t) up to 1.25mm

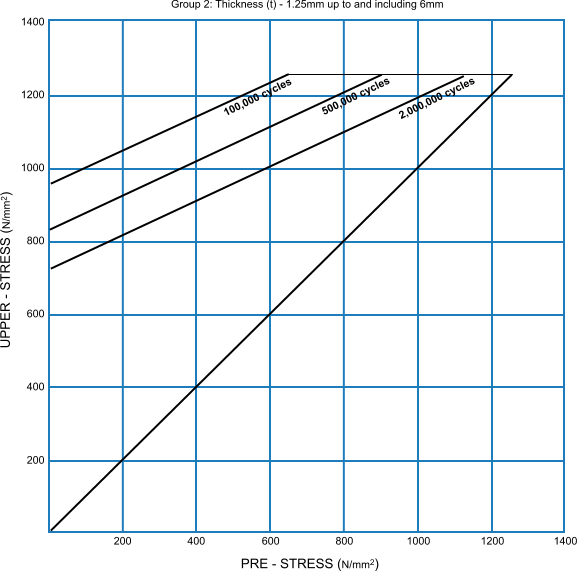
Group 2

Thickness (t) – 1.25mm up to and including 6mm

graph showing DIN 2093 - Group 2: Thickness (t) - 1.25mm up to and including 6mm

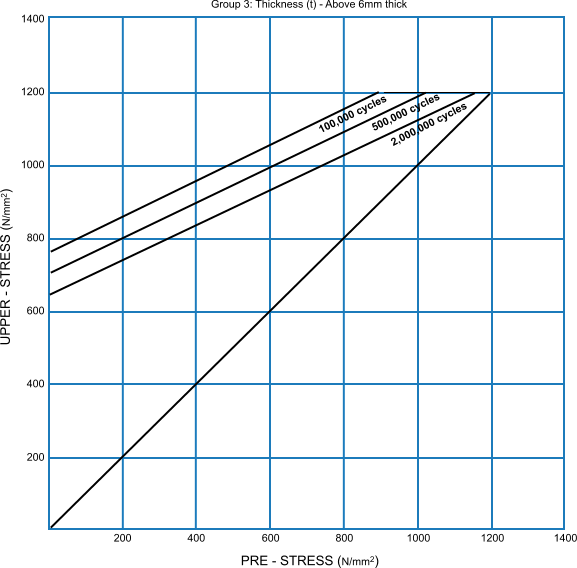
Group 3

Thickness (t) – Above 6mm thick

graph showing DIN 2093 - Group 3: Thickness (t) - Above 6mm thick

Example of Use of Fatigue Life Diagram

Disc Spring 15 x 5.2 x 0.4 (lo = 0.95) to DIN 2093 Specification – Cycling from 50% to 75% deflection.

  1. At 75% deflection, select the greater of tensile stress points δ II or δ III = 1002N/mm2 ( δ III).
  2. Select the tensile stress value for 50% deflection at same stress point (δ III) by extrapolation of value for 45% Deflection = 735N/mm2.
  3. Select 735N/mm 2 on pre-stress axis and read vertically to the point of intersection with 1002N/mm2 plotted horizontally from the upper-stress axis.
  4. Estimated fatigue use is in excess of two million cycles

Rules of Thumb

  1. The pre-load should be a minimum of 15% of available deflection
  2. The maximum deflection must not exceed 75% of the available deflection
  3. To improve the fatigue life, we can reduce the upper stress or increase the preload or both